Pineconnector Strategy Template (Connect Any Indicator)Hello traders,
If you're tired of manual trading and looking for a solid strategy template to pair with your indicators, look no further.
This Pine Script v5 strategy template is engineered for maximum customization and risk management.
Best part?
It’s optimized for Pineconnector, allowing seamless integration with MetaTrader 4 and 5.
This powerful tool gives a lot of power to those who don't know how to code in Pinescript and are looking to automate their indicators' signals on Metatrader 4/5.
IMPORTANT NOTES
Pineconnector is a trading bot software that forwards TradingView alerts to your Metatrader 4/5 for automating trading.
Many traders don't know how to dynamically create Pineconnector-compatible alerts using the data from their TradingView scripts.
Traders using trading bots want their alerts to reflect the stop-loss/take-profit/trailing-stop/stop-loss to break options from your script and then create the orders accordingly.
This script showcases how to create Pineconnector alerts dynamically.
Pineconnector doesn't support alerts with multiple Take Profits.
As a workaround, for 2 TPs, I had to open two trades.
It's not optimal, as we end up paying more spreads for that extra trade - however, depending on your trading strategy, it may not be a big deal.
TRADINGVIEW ALERTS
1) You'll have to create one alert per asset X timeframe = 1 chart.
Example: 1 alert for EUR/USD on the 5 minutes chart, 1 alert for EUR/USD on the 15-minute chart (assuming you want your bot to trade the EUR/USD on the 5 and 15-minute timeframes)
2) Select the Order fills and alert() function calls condition
3) For each alert, the alert message is pre-configured with the text below
{{strategy.order.alert_message}}
Please leave it as it is.
It's a TradingView native variable that will fetch the alert text messages built by the script.
4) Don't forget to set the Pineconnector webhook URL in the Notifications tab of the TradingView alerts UI.
You’ll find the URL on the Pineconnector documentation website.
EA CONFIGURATION
1) The Pyramiding in the EA on Metatrader must be set to 2 if you want to trade with 2 TPs => as it's opening 2 trades.
If you only want 1 TP, set the EA Pyramiding to 1.
Regarding the other EA settings, please refer to the Pineconnector documentation on their website.
2) In the EA, you can set a risk (= position size type) in %/lots/USD, as in the TradingView backtest settings.
KEY FEATURES
I) Modular Indicator Connection
* plug in your existing indicator into the template.
* Only two lines of code are needed for full compatibility.
Step 1: Create your connector
Adapt your indicator with only 2 lines of code and then connect it to this strategy template.
To do so:
1) Find in your indicator where the conditions print the long/buy and short/sell signals.
2) Create an additional plot as below
I'm giving an example with a Two moving averages cross.
Please replicate the same methodology for your indicator, whether it's a MACD , ZigZag , Pivots , higher-highs, lower-lows, or whatever indicator with clear buy and sell conditions.
//@version=5
indicator("Supertrend", overlay = true, timeframe = "", timeframe_gaps = true)
atrPeriod = input.int(10, "ATR Length", minval = 1)
factor = input.float(3.0, "Factor", minval = 0.01, step = 0.01)
= ta.supertrend(factor, atrPeriod)
supertrend := barstate.isfirst ? na : supertrend
bodyMiddle = plot(barstate.isfirst ? na : (open + close) / 2, display = display.none)
upTrend = plot(direction < 0 ? supertrend : na, "Up Trend", color = color.green, style = plot.style_linebr)
downTrend = plot(direction < 0 ? na : supertrend, "Down Trend", color = color.red, style = plot.style_linebr)
fill(bodyMiddle, upTrend, color.new(color.green, 90), fillgaps = false)
fill(bodyMiddle, downTrend, color.new(color.red, 90), fillgaps = false)
buy = ta.crossunder(direction, 0)
sell = ta.crossunder(direction, 0)
//////// CONNECTOR SECTION ////////
Signal = buy ? 1 : sell ? -1 : 0
plot(Signal, title = "Signal", display = display.data_window)
//////// CONNECTOR SECTION ////////
Important Notes
🔥 The Strategy Template expects the value to be exactly 1 for the bullish signal and -1 for the bearish signal
Now, you can connect your indicator to the Strategy Template using the method below or that one.
Step 2: Connect the connector
1) Add your updated indicator to a TradingView chart
2) Add the Strategy Template as well to the SAME chart
3) Open the Strategy Template settings, and in the Data Source field, select your 🔌Connector🔌 (which comes from your indicator)
Note it doesn’t have to be named 🔌Connector🔌 - you can name it as you want - however, I recommend an explicit name you can easily remember.
From then, you should start seeing the signals and plenty of other stuff on your chart.
🔥 Note that whenever you update your indicator values, the strategy statistics and visuals on your chart will update in real-time
II) Customizable Risk Management
- Choose between percentage or USD modes for maximum drawdown.
- Set max consecutive losing days and max losing streak length.
- I used the code from my friend @JosKodify for the maximum losing streak. :)
Will halt the EA and backtest orders fill whenever either of the safeguards above are “broken”
III) Intraday Risk Management
- Limit the maximum intraday losses both in percentage or USD.
- Option to set a maximum number of intraday trades.
- If your EA gets halted on an intraday chart, auto-restart it the next day.
IV) Spread and Account Filters
- Trade only if the spread is below a certain pip value.
- Set requirements based on account balance or equity.
V) Order Types and Position Sizing
- Choose between market, limit, or stop orders.
- Set your position size directly in the template.
Please use the position size from the “Inputs” and not the “Properties” tab.
Reason : The template sends the order on the same candle as the entry signals - at those entry signals candles, the position size isn’t computed yet, and the template can’t then send it to Pineconnector.
However, you can use the position size type (USD, contracts, %) from the “Properties” tab for backtesting.
In the EA, you can define the position size type for your orders in USD or lots or %.
VI) Advanced Take-Profit and Stop-Loss Options
- Choose to set your SL/TP in either pips or percentages.
- Option for multiple take-profit levels and trailing stop losses.
- Move your stop loss to break even +/- offset in pips for “risk-free” trades.
VII) Logger
The Pineconnector commands are logged in the TradingView logger.
You'll find more information about it in this TradingView blog post .
WHY YOU MIGHT NEED THIS TEMPLATE
1) Transform your indicator into a Pineconnector trading bot more easily than before
Connect your indicator to the template
Create your alerts
Set your EA settings
2) Save Time
Auto-generated alert messages for Pineconnector.
I tested them all, and I checked with the support team what could/can’t be done
3) Be in Control
Manage your trading risks with advanced features.
4) Customizable
Fits various trading styles and asset classes.
REQUIREMENTS
* Make sure you have your Pineconnector license ID.
* Create your alerts with the Pineconnector webhook URL
* If there is any issue with the template, ask me in the comments section - I’ll answer quickly.
BACKTEST RESULTS FROM THIS POST
1) I connected this strategy template to a dummy Supertrend script.
I could have selected any other indicator or concept for this script post.
I wanted to share an example of how you can quickly upgrade your strategy, making it compatible with Pineconnector.
2) The backtest results aren't relevant for this educational script publication.
I used realistic backtesting data but didn't look too much into optimizing the results, as this isn't the point of why I'm publishing this script.
This strategy is a template to be connected to any indicator - the sky is the limit. :)
3) This template is made to take 1 trade per direction at any given time.
Pyramiding is set to 1 on TradingView.
The strategy default settings are:
* Initial Capital: 100000 USD
* Position Size: 1 contract
* Commission Percent: 0.075%
* Slippage: 1 tick
* No margin/leverage used
WHAT’S COMING NEXT FOR YOU GUYS?
I’ll make the same template for ProfitView, then for AutoView, and then for Alertatron.
All of those are free and open-source.
I have no affiliations with any of those companies - I'm publishing those templates as they will be useful to many of you.
Dave
Pesquisar nos scripts por "Trailing stop"

Heatmap MACD Strategy - Pineconnector (Dynamic Alerts)Hello traders
This script is an upgrade of this template script.
Heatmap MACD Strategy
Pineconnector
Pineconnector is a trading bot software that forwards TradingView alerts to your Metatrader 4/5 for automating trading.
Many traders don't know how to dynamically create Pineconnector-compatible alerts using the data from their TradingView scripts.
Traders using trading bots want their alerts to reflect the stop-loss/take-profit/trailing-stop/stop-loss to breakeven options from your script and then create the orders accordingly.
This script showcases how to create Pineconnector alerts dynamically.
Pineconnector doesn't support alerts with multiple Take Profits.
As a workaround, for 2 TPs, I had to open two trades.
It's not optimal, as we end up paying more spreads for that extra trade - however, depending on your trading strategy, it may not be a big deal.
TradingView Alerts
1) You'll have to create one alert per asset X timeframe = 1 chart.
Example : 1 alert for EUR/USD on the 5 minutes chart, 1 alert for EUR/USD on the 15-minute chart (assuming you want your bot to trade the EUR/USD on the 5 and 15-minute timeframes)
2) For each alert, the alert message is pre-configured with the text below
{{strategy.order.alert_message}}
Please leave it as it is.
It's a TradingView native variable that will fetch the alert text messages built by the script.
3) Don't forget to set the webhook URL in the Notifications tab of the TradingView alerts UI.
EA configuration
The Pyramiding in the EA on Metatrader must be set to 2 if you want to trade with 2 TPs => as it's opening 2 trades.
If you only want 1 TP, set the EA Pyramiding to 1.
Regarding the other EA settings, please refer to the Pineconnector documentation on their website.
Logger
The Pineconnector commands are logged in the TradingView logger.
You'll find more information about it from this TradingView blog post
Important Notes
1) This multiple MACDs strategy doesn't matter much.
I could have selected any other indicator or concept for this script post.
I wanted to share an example of how you can quickly upgrade your strategy, making it compatible with Pineconnector.
2) The backtest results aren't relevant for this educational script publication.
I used realistic backtesting data but didn't look too much into optimizing the results, as this isn't the point of why I'm publishing this script.
3) This template is made to take 1 trade per direction at any given time.
Pyramiding is set to 1 on TradingView.
The strategy default settings are:
Initial Capital: 100000 USD
Position Size: 1 contract
Commission Percent: 0.075%
Slippage: 1 tick
No margin/leverage used
For example, those are realistic settings for trading CFD indices with low timeframes but not the best possible settings for all assets/timeframes.
Concept
The Heatmap MACD Strategy allows selecting one MACD in five different timeframes.
You'll get an exit signal whenever one of the 5 MACDs changes direction.
Then, the strategy re-enters whenever all the MACDs are in the same direction again.
It takes:
long trades when all the 5 MACD histograms are bullish
short trades when all the 5 MACD histograms are bearish
You can select the same timeframe multiple times if you don't need five timeframes.
For example, if you only need the 30min, the 1H, and 2H, you can set your timeframes as follow:
30m
30m
30m
1H
2H
Risk Management Features
All the features below are pips-based.
Stop-Loss
Trailing Stop-Loss
Stop-Loss to Breakeven after a certain amount of pips has been reached
Take Profit 1st level and closing X% of the trade
Take Profit 2nd level and close the remaining of the trade
Custom Exit
I added the option ON/OFF to close the opened trade whenever one of the MACD diverges with the others.
Help me help the community
If you see any issue when adding your strategy logic to that template regarding the orders fills on your Metatrader, please let me know in the comments.
I'll use your feedback to make this template more robust. :)
What's next?
I'll publish a more generic template built as a connector so you can connect any indicator to that Pineconnector template.
Then, I'll publish a template for Capitalise AI, ProfitView, AutoView, and Alertatron.
Thank you
Dave

Double AI Super Trend Trading - Strategy [PresentTrading]█ Introduction and How It is Different
The Double AI Super Trend Trading Strategy is a cutting-edge approach that leverages the power of not one, but two AI algorithms, in tandem with the SuperTrend technical indicator. The strategy aims to provide traders with enhanced precision in market entry and exit points. It is designed to adapt to market conditions dynamically, offering the flexibility to trade in both bullish and bearish markets.
*The KNN part is mainly referred from @Zeiierman.
BTCUSD 8hr performance
ETHUSD 8hr performance
█ Strategy, How It Works: Detailed Explanation
1. SuperTrend Calculation
The SuperTrend is a popular indicator that captures market trends through a combination of the Volume-Weighted Moving Average (VWMA) and the Average True Range (ATR). This strategy utilizes two sets of SuperTrend calculations with varying lengths and factors to capture both short-term and long-term market trends.
2. KNN Algorithm
The strategy employs k-Nearest Neighbors (KNN) algorithms, which are supervised machine learning models. Two sets of KNN algorithms are used, each focused on different lengths of historical data and number of neighbors. The KNN algorithms classify the current SuperTrend data point as bullish or bearish based on the weighted sum of the labels of the k closest historical data points.
3. Signal Generation
Based on the KNN classifications and the SuperTrend indicator, the strategy generates signals for the start of a new trend and the continuation of an existing trend.
4. Trading Logic
The strategy uses these signals to enter long or short positions. It also incorporates dynamic trailing stops for exit conditions.
Local picture
█ Trade Direction
The strategy allows traders to specify their trading direction: long, short, or both. This enables the strategy to be versatile and adapt to various market conditions.
█ Usage
ToolTips: Comprehensive tooltips are provided for each parameter to guide the user through the customization process.
Inputs: Traders can customize numerous parameters including the number of neighbors in KNN, ATR multiplier, and types of moving averages.
Plotting: The strategy also provides visual cues on the chart to indicate bullish or bearish trends.
Order Execution: Based on the generated signals, the strategy will execute buy or sell orders automatically.
█ Default Settings
The default settings are configured to offer a balanced approach suitable for most scenarios:
Initial Capital: $10,000
Default Quantity Type: 10% of equity
Commission: 0.1%
Slippage: 1
Currency: USD
These settings can be modified to suit various trading styles and asset classes.

AI SuperTrend - Strategy [presentTrading]
█ Introduction and How it is Different
The AI Supertrend Strategy is a unique hybrid approach that employs both traditional technical indicators and machine learning techniques. Unlike standard strategies that rely solely on traditional indicators or mathematical models, this strategy integrates the power of k-Nearest Neighbors (KNN), a machine learning algorithm, with the tried-and-true SuperTrend indicator. This blend aims to provide traders with more accurate, responsive, and context-aware trading signals.
*The KNN part is mainly referred from @Zeiierman.
BTCUSD 8hr performance
ETHUSD 8hr performance
█ Strategy, How it Works: Detailed Explanation
SuperTrend Calculation
Volume-Weighted Moving Average (VWMA): A VWMA of the close price is calculated based on the user-defined length (len). This serves as the central line around which the upper and lower bands are calculated.
Average True Range (ATR): ATR is calculated over a period defined by len. It measures the market's volatility.
Upper and Lower Bands: The upper band is calculated as VWMA + (factor * ATR) and the lower band as VWMA - (factor * ATR). The factor is a user-defined multiplier that decides how wide the bands should be.
KNN Algorithm
Data Collection: An array (data) is populated with recent n SuperTrend values. Corresponding labels (labels) are determined by whether the weighted moving average price (price) is greater than the weighted moving average of the SuperTrend (sT).
Distance Calculation: The absolute distance between each data point and the current SuperTrend value is calculated.
Sorting & Weighting: The distances are sorted in ascending order, and the closest k points are selected. Each point is weighted by the inverse of its distance to the current point.
Classification: A weighted sum of the labels of the k closest points is calculated. If the sum is closer to 1, the trend is predicted as bullish; if closer to 0, bearish.
Signal Generation
Start of Trend: A new bullish trend (Start_TrendUp) is considered to have started if the current trend color is bullish and the previous was not bullish. Similarly for bearish trends (Start_TrendDn).
Trend Continuation: A bullish trend (TrendUp) is considered to be continuing if the direction is negative and the KNN prediction is 1. Similarly for bearish trends (TrendDn).
Trading Logic
Long Condition: If Start_TrendUp or TrendUp is true, a long position is entered.
Short Condition: If Start_TrendDn or TrendDn is true, a short position is entered.
Exit Condition: Dynamic trailing stops are used for exits. If the trend does not continue as indicated by the KNN prediction and SuperTrend direction, an exit signal is generated.
The synergy between SuperTrend and KNN aims to filter out noise and produce more reliable trading signals. While SuperTrend provides a broad sense of the market direction, KNN refines this by predicting short-term price movements, leading to a more nuanced trading strategy.
Local picture
█ Trade Direction
The strategy allows traders to choose between taking only long positions, only short positions, or both. This is particularly useful for adapting to different market conditions.
█ Usage
ToolTips: Explains what each parameter does and how to adjust them.
Inputs: Customize values like the number of neighbors in KNN, ATR multiplier, and moving average type.
Plotting: Visual cues on the chart to indicate bullish or bearish trends.
Order Execution: Based on the generated signals, the strategy will execute buy/sell orders.
█ Default Settings
The default settings are selected to provide a balanced approach, but they can be modified for different trading styles and asset classes.
Initial Capital: $10,000
Default Quantity Type: 10% of equity
Commission: 0.1%
Slippage: 1
Currency: USD
By combining both machine learning and traditional technical analysis, this strategy offers a sophisticated and adaptive trading solution.

Market Structure CHoCH/BOS (Fractal) [LuxAlgo]The Market Structure CHoCH/BOS (Fractal) indicator is an experimental take on classical market structure, whereas fractal patterns are used for their construction instead of swing points.
Compared to utilizing swing points for highlighting market structure like our Smart Money Concepts indicator , fractal-based market structure can appear as more adaptive, however, it can also be more restrictive when it comes to returning swing points which can cause the indicator to miss reversals in some cases.
If enabled from within the settings, users can see support and resistance levels returned from the detected market structure with breakouts highlighted on the chart. Alongside this feature, an additional dashboard showing the structure to fractal structure percentage is also provided.
🔶 SETTINGS
Length: Length of the fractal patterns to detect.
🔹 Style
Bullish Structures: Show bullish structures.
Bearish Structures: Show bullish structures.
Support: Show support levels.
Resistance: Show resistance levels.
🔹 Dashboard
Show Dashboard: Show structure to fractal percentage dashboard on the chart.
Location: Location of the dashboard on the chart.
Size: Dashboard size.
🔶 USAGE
Market structure is commonly used to determine trend direction by using price positions relative to prior swing points. Using fractal patterns to determine market structure can allow users to obtain shorter, more frequent structure labels.
Market structure is commonly classified as follows:
Change of Character (CHoCH), also referred to as Market Structure Shift (MSS)
Break of Structure (BOS), also referred to as Market Structure Break (MSB)
Change of Characters indicate a shift in the market trend, confirming trend reversals. Break of Structures on the other hand occur once a trend is already determined, confirming new higher highs/lower lows.
Using higher length values allow users to detect longer-term fractals, thus highlighting longer-term market structures. The image above detects fractal patterns made of 7 candles, even if the increment is only of 2 bars this significantly reduces the amount of detected market structure labels.
The result obtained by utilizing fractals and higher settings can be a more dynamic view of market structure, however, as seen in the image above this can introduce very significant delay compared to utilizing pure swing points.
🔹 Support/Resistance
The indicator also returns support/resistance levels constructed from the market structure, these levels are obtained similarly to order blocks, finding the minimum on the interval of a bullish market structure and the maximum of a bearish market structure.
Price reaching a support/resistance level can be expected to bounce from it. Once a level is broken, the support/resistance level will no longer extend, and a circle will be displayed highlighting the break.
While utilizing this script for fractal-based market structure, these levels can be useful to ensure all swing points are still considered by the user with the possibility of the indicator missing reversals due to its calculation not being based on swing points themselves.
🔹 Dashboard
The dashboard reports the structure to fractal percentage, that is the amount of bullish/bearish market structures relative to the total amount of detected bullish/bearish fractal patterns.
This allows us to see how often a detected fractal pattern is used to display a market structure.
🔶 DETAILS
🔹 Fractals
In the context of technical analysis, Fractals refer to specific patterns that exhibit self-similarity at different scales or timeframes.
The most commonly known fractal pattern consists of a consecutive sequence of candles (more commonly 5), with the central candle being the lowest (in case of a bullish fractal) or highest (in case of a bearish fractal).
A bullish fractal has candles on the right side of the central candle with increasing lows, while candles on the left side have decreasing lows.
A bearish fractal has candles on the right side of the central candle with decreasing highs, while candles on the left side have increasing highs.
🔶 RELATED SCRIPTS
🔹 Smart Money Concepts
🔹 Market Structure Trailing Stop
🔹 ICT Concepts

D-BoT Alpha 'Short' SMA and RSI StrategyDostlar selamlar,
İşte son derece basit ama etkili ve hızlı, HTF de çok iyi sonuçlar veren bir strateji daha, hepinize bol kazançlar dilerim ...
Nedir, Nasıl Çalışır:
Strateji, iki ana girdiye dayanır: SMA ve RSI. SMA hesaplama aralığı 200 olarak, RSI ise 14 olarak ayarlanmıştır. Bu değerler, kullanıcı tercihlerine veya geriye dönük test sonuçlarına göre ayarlanabilir.
Strateji, iki koşul karşılandığında bir short sinyali oluşturur: RSI değeri, belirlenen bir giriş seviyesini (burada 51 olarak belirlenmiş) aşar ve kapanış fiyatı SMA değerinin altındadır.
Strateji, kısa pozisyonu üç durumda kapatır: Kapanış fiyatı, takip eden durdurma seviyesinden (pozisyon açıldığından beri en düşük kapanış olarak belirlenmiştir) büyükse, RSI değeri belirlenen bir durdurma seviyesini (bu durumda 54) aşarsa veya RSI değeri belirli bir kar al seviyesinin (bu durumda 32) altına düşerse.
Güçlü Yönleri:
İki farklı gösterge (SMA ve RSI) kullanımı, yalnızca birini kullanmaktan daha sağlam bir sinyal sağlayabilir.
Strateji, karları korumaya ve fiyat dalgalanmalarında kayıpları sınırlamaya yardımcı olabilecek bir iz süren durdurma seviyesi içerir.
Script oldukça anlaşılır ve değiştirmesi nispeten kolaydır.
Zayıf Yönleri:
Strateji, hacim, oynaklık veya daha geniş piyasa eğilimleri gibi diğer potansiyel önemli faktörleri göz önünde bulundurmaz.
RSI seviyeleri ve SMA süresi için belirli parametreler sabittir ve tüm piyasa koşulları veya zaman aralıkları için optimal olmayabilir.
Strateji oldukça basittir. Trade maliyetini (kayma veya komisyonlar gibi) hesaba katmaz, bu da trade performansını önemli ölçüde etkileyebilir.
Bu Stratejiyle Nasıl İşlem Yapılır:
Strateji, short işlemler için tasarlanmıştır. RSI, 51'in üzerine çıktığında ve kapanış fiyatı 200 periyotluk SMA'nın altında olduğunda işleme girer. RSI, 54'ün üzerine çıktığında veya 32'nin altına düştüğünde veya fiyat, pozisyon açıldığından beri en düşük kapanış fiyatının üzerine çıktığında işlemi kapatır.
Lütfen Dikkat, bu strateji veya herhangi bir strateji izole bir şekilde kullanılmamalıdır. Tüm bu çalışmalar eğitsel amaçlıdır. Yatırım tavsiyesi içermez.
This script defines a trading strategy based on Simple Moving Average (SMA) and the Relative Strength Index (RSI) indicators. Here's an overview of how it works, along with its strengths and weaknesses, and how to trade using this strategy:
How it works:
The strategy involves two key inputs: SMA and RSI. The SMA length is set to 200, and the RSI length is set to 14. These values can be adjusted based on user preferences or back-testing results.
The strategy generates a short signal when two conditions are met: The RSI value crosses over a defined entry level (set at 51 here), and the closing price is below the SMA value.
When a short signal is generated, the strategy opens a short position.
The strategy closes the short position under three conditions: If the close price is greater than the trailing stop (which is set as the lowest close since the position opened), if the RSI value exceeds a defined stop level (54 in this case), or if the RSI value drops below a certain take-profit level (32 in this case).
Strengths:
The use of two different indicators (SMA and RSI) can provide a more robust signal than using just one.
The strategy includes a trailing stop, which can help to protect profits and limit losses as the price fluctuates.
The script is straightforward and relatively easy to understand and modify.
Weaknesses:
The strategy doesn't consider other potentially important factors, such as volume, volatility, or broader market trends.
The specific parameters for the RSI levels and SMA length are hard-coded, and may not be optimal for all market conditions or timeframes.
The strategy is very simplistic. It doesn't take into account the cost of trading (like slippage or commissions), which can significantly impact trading performance.
How to trade with this strategy:
The strategy is designed for short trades. It enters a trade when the RSI crosses above 51 and the closing price is below the 200-period SMA. It will exit the trade when the RSI goes above 54 or falls below 32, or when the price rises above the lowest closing price since the position was opened.
Please note, this strategy or any strategy should not be used in isolation. It's important to consider other aspects of trading such as risk management, capital allocation, and combining different strategies to diversify. Back-testing the strategy on historical data and demo trading before going live is also a recommended practice.

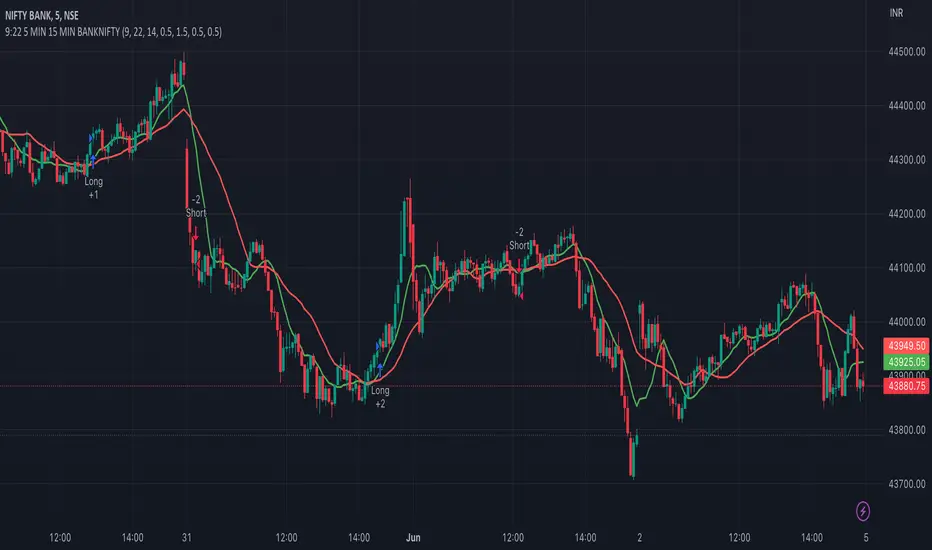
9:22 5 MIN 15 MIN BANKNIFTY9:22 5 MIN 15 MIN BANKNIFTY Strategy with Additional Filters
The 9:22 5 MIN 15 MIN BANKNIFTY Strategy with Additional Filters is a trend-following strategy designed for trading the BANKNIFTY instrument on a 5-minute chart. It aims to capture potential price movements by generating buy and sell signals based on moving average crossovers, breakout confirmations, and additional filters.
Key Features:
Fast MA Length: 9
Slow MA Length: 22
ATR Length: 14
ATR Filter: 0.5
Trailing Stop Percentage: 1.5%
Pullback Threshold: 0.5
Minimum Candle Body Percentage: 0.5
Use Breakout Confirmation: Enabled
Additional Filters:
Volume Threshold: Set a minimum volume requirement for trades.
Trend Filter: Optionally enable a trend filter based on a higher timeframe moving average.
Momentum Filter: Optionally enable a momentum filter using the RSI indicator.
Support/Resistance Filter: Optionally enable a filter based on predefined support and resistance levels.
Buy and Sell Signals:
Buy Signal: A buy signal is generated when the fast moving average crosses above the slow moving average, with additional confirmation from breakout and volume criteria, along with optional trend, momentum, and support/resistance filters.
Sell Signal: A sell signal is generated when the fast moving average crosses below the slow moving average, with similar confirmation and filtering criteria as the buy signal.
Exit Strategy:
The strategy employs a trailing stop-loss mechanism based on a percentage of the average entry price. The stop-loss is dynamically adjusted to protect profits while allowing for potential upside.
Please note that this strategy should be thoroughly backtested and evaluated in different market conditions before applying it to live trading. It is also recommended to adjust the parameters and filters according to individual preferences and risk tolerance.
Feel free to customise and adapt the description as needed to suit your preferences and the specific details of your strategy.
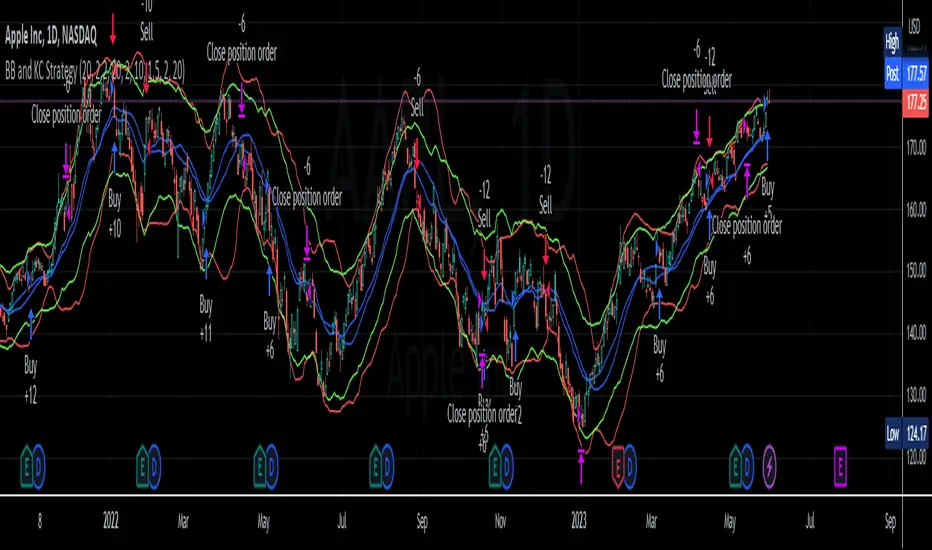
BB and KC StrategyThis script is designed as a TradingView strategy that uses Bollinger Bands (BB) and Keltner Channels (KC) as the primary indicators for generating trade signals. It aims to catch potential market trends by comparing the movements of these two popular volatility measures.
Key aspects of this strategy:
1. **Bollinger Bands and Keltner Channels:** Both are volatility-based indicators. The Bollinger Bands consist of a middle band (simple moving average) and two outer bands calculated based on standard deviation, which adjusts itself to market conditions. Keltner Channels are a set of bands placed above and below an exponential moving average of the price. The distance between the bands is calculated based on the Average True Range (ATR), a measure of price volatility.
2. **Entry Signals:** The strategy enters a long position when the upper KC line crosses above the upper BB line and the volume is above its moving average. Conversely, it enters a short position when the lower KC line crosses below the lower BB line and the volume is above its moving average.
3. **Exit Signals:** The strategy exits a position under two conditions. First, if the trade has been open for a certain number of bars defined by the user (default 20 bars). Second, a stop loss and trailing stop are in place to limit potential losses and lock in profits as the price moves favorably. The stop loss is set at a percentage of the entry price (default 1.5% for long and -1.5% for short), and the trailing stop is also a percentage of the entry price (default 2%).
4. **Trade Quantity:** The script allows specifying the investment amount for each trade, set to a default of 1000 currency units.
Remember, this is a strategy script, which means it is used for backtesting and not for real-time signals or live trading. It is also recommended that it is used as a tool to aid your trading, not as a standalone system. As with any strategy, it should be tested over different market conditions and used in conjunction with other aspects of technical and fundamental analysis to ensure robustness and effectiveness.
Strat Trail Stop by AlexsOptionsWhat does this script do?
This script plots previous aggregation highs or lows based on the trend of the candles.
Scenario 1 -> Up Trend
If the previous high of a candle is violated the green trail line will trail using the lows of the prior candle. It will continue until a previous low is violated. Once a previous low is violated it will switch to scenario 2
Scenario 2 -> Down Trend
If the previous low of a candle is violated the red trail line will trail using the highs of the prior candle. It will continue until a previous high is violated. Once a previous high is violated it will switch to scenario 1
This indicator has two trails. One is expected to be a lower timeframe the other a higher timeframe.
The higher timeframe has an option to instead use the open of the higher timeframe instead of the trail logic in the scenarios above.
If selected it will plot the open of the designated timeframe, the color will be green if trading above and red if trading below
This script is best used in conjunction with a good understanding of #TheStrat trading strategy. You are then able to create alerts for when your positions fall out of favor.
Dynamic Stop Loss DemoWhat does this script do ?
This script is for pine script programmers and explains how to implement a dynamic stop-loss strategy. It is different from trailing stop-loss. Trailing stop-loss can only set the retracement value, but this script can take profit on part of the position at a fixed price and allows users to decide whether to take profit on all positions based on whether a certain track is breached or other conditions author want. In this demo, it use rsi crossover and crossunder to decide the strategy condition, and use close price as open price, and use lowest low / highest high as stop price, and use 1.5 risk ratio to calculate the fixed first profit price. It will take 50% position size when the first profit price was reached. Then it will close all rest positions when the inverse condition come out or the dynamic stop(calculated by ATR) breached or when the price back to the open price or the stop price.
How is this script implemented
When start strategy by strategy.entry , it gives a custom id which contains direction, openPrice, stopPrice, profitPrice, qty, etc. It can be get from the global variable strategy.posiition_entry_name .

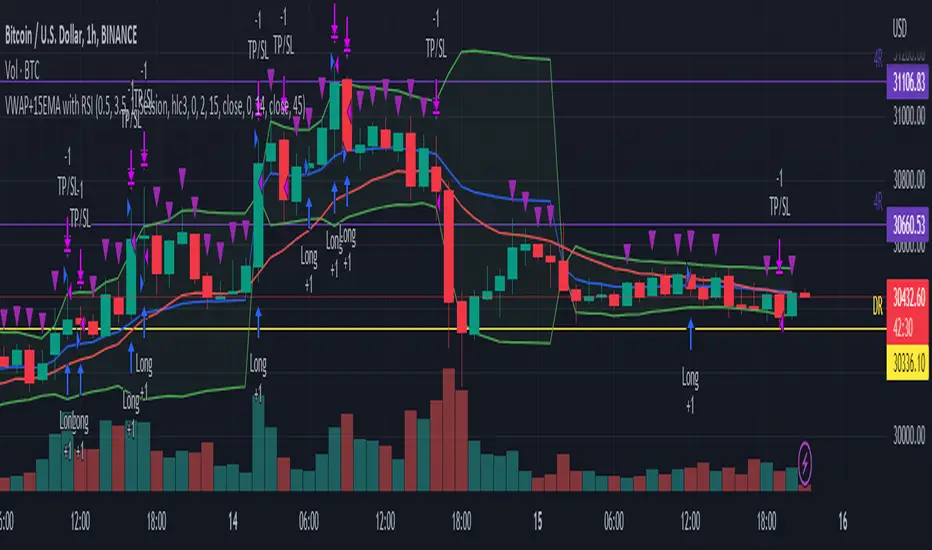
VWAP+15EMA with RSIVWAP+EMA+RSI Strategy for the group MelléCasH
This strategy will enter a long position when the closing price is above both the VWAP and the 15 EMA, and the RSI is above the specified overbought level. It will exit the position when the price falls by the specified stop loss percentage, rises by the specified take profit percentage, or when the trailing stop loss (which trails the highest price achieved after the position was entered by the specified percentage) is hit. The VWAP, EMA, and RSI indicators are also plotted on the chart for reference.
BankNifty 5min Supertrend Based StrategyBankNifty 5min Supertrend Based Strategy, Intraday.
Work Best at 5mint chart on BankNifty.
The strategy is designed to trade using the Supertrend indicator with session-based rules, and risk management. It allows for customization through input variables and aims to provide a clear visual representation of the Supertrend by changing the color .
The script also includes input variables for the trading session and date range, which allows the trader to specify the time period in which they want the strategy to run. The session variable specifies the start and end times of the trading session, which in this case is set to the Indian trading session from 9:15 am to 3:10 pm.
The strategy starts by defining input variables such as the session time, start and end date for the backtesting, the length of the ATR, and the Supertrend factor. It also includes options for delay at session start and stop loss points and trail percentage .
The code then checks if the current time is within the specified session and date range . If it is, the Supertrend and its direction are calculated using the defined input variables. The strategy then waits for N numbers of candles (defined by the User) to form at the start of every session i.e. 09:15 AM before entering a trade.
The entry and exit conditions for long and short trades are defined based on the change in the Supertrend direction and the number of candles formed at the session start i.e. 09:15 AM . After that, it takes entry and exit for long and short trades on the change in the Supertrend direction . Stop-loss and trailing stop-loss are also defined based on the input variables.
Stop-loss (Defined by the user) is fixed points either below or above the Entry Price for Long and Short entries.
The Supertrend plot is displayed with changing colors depending on the direction. Finally, the strategy closes all trades at the end of the session if there are any open trades.
Overall, this strategy aims to trade with the Supertrend indicator using session-based rules and risk management.
However, as with any trading strategy, it is important to thoroughly test it before using it in live trading .

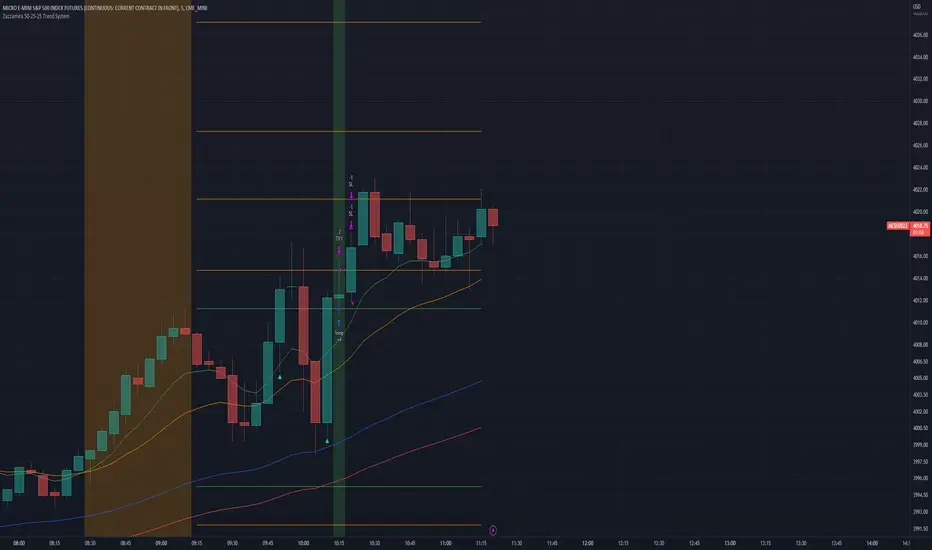
Zazzamira 50-25-25 Trend System Alerts OnlyPublishing my trading system script. It consist of several conditions to happen in order to open a trade. Work best on ES/MES 5 minute timeframe.
I like to use it with this settings:
- UTC -6 (don't tick Exchange Timezone)
and rest as default
To enter a trade, the following conditions must be met: Entry 1: the opening range (8:30AM - 9:15AM UTC-6) must be defined and the price must close above or below the opening range on the 5-minute timeframe. This entry condition defines the trade direction (above = long / below = short). Once the opening range is defined, the Trend-Based Fib Extension is applied from the range high to the range low (and vice versa). Fib levels are required for Exit conditions. Entry 2: the 8 - 27 - 67 - 97 EMAs must be defined. If the EMAs value order is 8 > 27 > 67 > 97, long-only trades are allowed. If the EMAs value order is 8 < 27 < 67 < 97, short-only trades are allowed. This entry condition filters fake breakouts of Entry 1. Entry 3: no trades are allowed after 12:59 UTC-6 (2PM EST). Entry 4: if Entry 1, Entry 2, and Entry 3 conditions are valid and the price hasn't reached the 23.6% Fib line, an entry order can be set at the range high/long with 4 contracts. To exit a trade, the following conditions must be met: Exit 1 (Stop loss): set a trailing stop based on 2.1x ATR (14) from entry. Exit 2: take 50% profits at the 23.6% Fib and leave trailing stop untouched. Exit 3: if Exit 2 triggers, take 50% (25% of total entry) off at 61.8% Fib, leaving Exit 2 trailing stop values valid. Exit 4: exit the full position at the FIB 100% value. Exit 5: all trades must be closed at 3pm UTC-6 (4PM EST). So basically Take Profit are 50%-25%-25% of position.
Code has been written by © Hiubris_Indicators who has been an amazing coder and gave me the possibility to make this script public so a really big shoutout to him.
This indicator only works for alerts, please check version without alerts to backtest or tweaks. This indicator is meant to be used to automate the system via webhooks

Zazzamira 50-25-25 Trend SystemPublishing my trading system script. It consist of several conditions to happen in order to open a trade. Work best on ES/MES 5 minute timeframe.
I like to use it with this settings:
- UTC -6 (don't tick Exchange Timezone)
and rest as default
To enter a trade, the following conditions must be met: Entry 1: the opening range (8:30AM - 9:15AM UTC-6) must be defined and the price must close above or below the opening range on the 5-minute timeframe. This entry condition defines the trade direction (above = long / below = short). Once the opening range is defined, the Trend-Based Fib Extension is applied from the range high to the range low (and vice versa). Fib levels are required for Exit conditions. Entry 2: the 8 - 27 - 67 - 97 EMAs must be defined. If the EMAs value order is 8 > 27 > 67 > 97, long-only trades are allowed. If the EMAs value order is 8 < 27 < 67 < 97, short-only trades are allowed. This entry condition filters fake breakouts of Entry 1. Entry 3: no trades are allowed after 12:59 UTC-6 (2PM EST). Entry 4: if Entry 1, Entry 2, and Entry 3 conditions are valid and the price hasn't reached the 23.6% Fib line, an entry order can be set at the range high/long with 4 contracts. To exit a trade, the following conditions must be met: Exit 1 (Stop loss): set a trailing stop based on 2.1x ATR (14) from entry. Exit 2: take 50% profits at the 23.6% Fib and leave trailing stop untouched. Exit 3: if Exit 2 triggers, take 50% (25% of total entry) off at 61.8% Fib, leaving Exit 2 trailing stop values valid. Exit 4: exit the full position at the FIB 100% value. Exit 5: all trades must be closed at 3pm UTC-6 (4PM EST). So basically Take Profit are 50%-25%-25% of position.
Code has been written by © Hiubris_Indicators who has been an amazing coder and gave me the possibility to make this script public so a really big shoutout to him.
E5TradingLibrary
This library replaces the previous MetaWorldEngineFilterLibrary3.
Library "E5TradingLibrary"
GetCandleStickSize(_src_high, _src_low)
returns size of the candle
Parameters:
_src_high
_src_low
Returns: candlestick size
GetCandleStickBodySize(_src_open, _src_close)
returns size of the candle body
Parameters:
_src_open
_src_close
Returns: candlestick body size
FilterLongerLowerWickCandles(_src_open, _src_close, _src_low)
Alters Candlestick Value to Magnify Candles with Long Wicks
Parameters:
_src_open
_src_close
_src_low
Returns: Midpoint of the candle body less the lower wick. If value returned has a large delta from midpoint of the body, then it is short wick
IsBullish(_src_open, _src_close)
Determine if Candle is Bullish or Bearish
Parameters:
_src_open
_src_close
Returns: True is Bullish
IsDoji(_candleIndex, _precision)
Determine if Candle is a Doji
Parameters:
_candleIndex
_precision
Returns: True if a Doji
MACD(_src, _fastLength, _slowLength, _signalLength)
Computes MACD
Parameters:
_src
_fastLength
_slowLength
_signalLength
Returns: Returns MACD and Signal Line
isFastSlowCrossed(SeriesA, SeriesB)
Computes if SeriesA crosses SeriesB
Parameters:
SeriesA
SeriesB
Returns: if SeriesA crosses SeriesB then true else false
isReversalUpTrend(SeriesA, SeriesB)
Computes if SeriesA crosses over SeriesB to determine reversal uptrend
Parameters:
SeriesA
SeriesB
Returns: if SeriesA crosses over SeriesB then true else false
isReversalDownTrend(SeriesA, SeriesB)
Computes if SeriesA crosses over SeriesB to determine reversal uptrend
Parameters:
SeriesA
SeriesB
Returns: if SeriesA crosses over SeriesB then true else false
SSMA(_src, smalength)
Computes smoothed SMA
Parameters:
_src
smalength
Returns: a single concatenated string for evaluation
GetTimeFrame()
Get Current timeframe in minutes
Returns: an integer value in minutes
getMA(_src, length, maType)
Gets a Moving Average based on type
Parameters:
_src
length
maType
Returns: A moving average with the given parameters
ATRSwitch(_src, _ATRMult, _ATRLength)
Average True Range Trailing Stops by Sylvain Vervoort
Parameters:
_src
_ATRMult
_ATRLength
Returns: upper ATR Line, lower ATR Line and the switch point

Volatility Weighted Moving AverageVolatility Weighted Moving Average (VAWMA) :
The Volatility Weighted Moving Average is a short and long term trend filter that weightes asset price buy "volatility significance" (percentages of total volatility over specified period) unlike that of the WMA which formulates an average based on the product of asset price and a deceding period significance . The result is a less noisy average which weights price based on its potential significance in trend, VAWMA tends to price when volatility is high and conversaly tends away from price when volatility is low.
Example :
As seen above the VAWMA tends to price more than both the SMA and EMA. The high volatility weightings allow for the VWMA to act as a potential trailing stop.
Dynamics :
- symbol volatility watchlist, change the ticker and corrosponding exchange to watch volatility over other markets.

Ichimoku Cloud and ADX with Trailing Stop Loss (by Coinrule)The Ichimoku Cloud is a collection of technical indicators that show support and resistance levels, as well as momentum and trend direction. It does this by taking multiple averages and plotting them on a chart. It also uses these figures to compute a “cloud” that attempts to forecast where the price may find support or resistance in the future.
The Ichimoku Cloud was developed by Goichi Hosoda, a Japanese journalist, and published in the late 1960s. It provides more data points than the standard candlestick chart. While it seems complicated at first glance, those familiar with how to read the charts often find it easy to understand with well-defined trading signals.
The Ichimoku Cloud is composed of five lines or calculations, two of which comprise a cloud where the difference between the two lines is shaded in.
The lines include a nine-period average, a 26-period average, an average of those two averages, a 52-period average, and a lagging closing price line.
The cloud is a key part of the indicator. When the price is below the cloud, the trend is down. When the price is above the cloud, the trend is up.
The above trend signals are strengthened if the cloud is moving in the same direction as the price. For example, during an uptrend, the top of the cloud is moving up, or during a downtrend, the bottom of the cloud is moving down.
DMI is simple to interpret. When +DI > - DI, it means the price is trending up. On the other hand, when -DI > +DI, the trend is weak or moving on the downside. The ADX does not give an indication of the direction but about the strength of the trend.
Typically values of ADX above 25 mean that the trend is steeply moving up or down, based on the -DI and +DI positioning. This script aims to capture swings in the DMI, and thus, in the trend of the asset, using a contrarian approach.
Trading on high values of ADX, the strategy tries to spot extremely oversold and overbought conditions. Values of ADX above 45 may suggest that the trend has overextended and is maybe about to reverse.
This strategy combines the Ichimoku Cloud with the ADX indicator to better enter trades.
Long orders are placed when these basic signals are triggered.
Long Position:
Tenkan-Sen is above the Kijun-Sen
Chikou-Span is above the close of 26 bars ago
Close is above the Kumo Cloud
MACD line crosses over the signal line
-DI is greater than +DI
ADX is greater than 45
Close Position:
3% increase trailing
3% decrease trailing
The script is backtested from December 2022 and provides good returns.
A trading fee of 0.1% is also taken into account and is aligned to the base fee applied on Binance.

Super 8 - 30M BTCWelcome to Super 8, the ultimate automatic trading script for Pine!
This bad boy is designed to go both long and short, and it's equipped with all the tools you need to maximize your profits. Whether you're looking to take profit, set a trailing stop, or protect yourself with a stop loss, Super 8 has you covered.
But that's not all! Super 8 is also loaded with 8 powerful indicators to help you make informed decisions. We've got the EMA, ADX, SAR, MACD, VOLUME, BOLLINGER BANDS, DONCHIAN, and ATR all working together to give you the best possible trading experience.
And if you want to take it to the next level, Super 8 also has a feature that lets you use stepped entries in normal mode or incremental 1,2,3,... to improve your average price. Plus, if you're using trailing stop, you can activate the Backtest precision to use lower timeframes.
But what's in a name? Super 8 is called that because it's just that... super! It's tailored specifically for the OKX:BTCUSDT.P pair, so you know you're getting the best possible results. it's highly adjustable and can be used with any other pair. So no matter what market you're trading in, Super 8 has got you covered.
So if you want to level up your trading game, give Super 8 a try. You won't be disappointed.
Certain Risks of Live Algorithmic Trading:
Backtesting Cannot Assure Actual Results.
The relevant market might fail or behave unexpectedly.
Your broker may experience failures in its infrastructure, fail to execute your orders in a correct or timely fashion or reject your orders.
The system you use for generating trading orders, communicating those orders to your broker, and receiving queries and trading results from your broker may fail.
Time lag at various point in live trading might cause unexpected behavior.
The systems of third parties in addition to those of the provider from which we obtain various services, your broker, and the applicable securities market may fail or malfunction.

ATR_RSI_Strategy v2 with no repaint [liwei666]🎲 Overview
🎯 this is a optimized version based on ATR_RSI_Strategy with no-repaint.
Sharpe ratio: 1.4, trade times: 116 ,
trade symbol: BINANCE:BTCUSDTPERP 15M
you can get same backtesting result with the correct settings.
🎲 Strategy Logic
🎯 the core logic is quite simple, use ATR and RSI and SMA
1. when price is in high volatility ( atr_value > atr_ma);
2. wait for a break signal (rsi_value > rsi_buy or rsi_value < rsi_sell);
3. entry Long or Short,use trailing stop-loss to max security and percent TP to keep profit.
🎲 Settings
🎯 there are 7 input properties in script, but I only finetune 4 of them ( bold field below ),
you may change other parameter to get better result by yourself.
atr_length: length to get atr value
atr_ma_length : length of smoothing atr value
atr_ma_norm_min : atr_ma normalized min value, filter high volatility ranges
atr_ma_norm_max : atr_ma normalized max value, filter high volatility ranges
rsi_length : length to get rsi value
rsi_entry: 50 +/- rsi_entry to get entry threshold
trailing_percent: trailing stop-loss percent
🎲 Usage
🎯 the commission set to 0.05% , part of exchange the commission is less than 0.05% in reality,
but I will still use 0.05% in my next script.
🎯 this script use 50% of equity to size positions follow general script position,
you can adjust the value to fix size or 100% of equity to compare result with other strategy,
but I still suggest you use 5-10% of equity for each strategy in reality.
🎯any questions please comment below. if there are any words violate House Rule, please tell me below and i will revise immediately
don't want be hiddened again 😂😂
Additionally, I plan to publish 20 profitable strategies in 2023;
let‘s witness it together!
Hope this strategy will be usefull for you :)
enjoy! 🚀🚀🚀

RSI and MA with Trailing Stop Loss and Take Profit (by Coinrule)The relative strength index is a momentum indicator used in technical analysis. It measures the speed and magnitude of a coin's recent price changes to evaluate overvalued or undervalued conditions in the price of that coin. The RSI is displayed as an oscillator (a line graph essentially) on a scale of zero to 100. When the RSI reaches oversold levels, it can provide a signal to go long. When the RSI reaches overbought levels, it can mark a good exit point or alternatively, an entry for a short position. Traditionally, an RSI reading of 70 or above indicates an overbought situation. A reading of 30 or below indicates an oversold condition.
A moving average (MA) calculates the average of a selected range of prices, usually closing prices, by the number of periods in that range. Essentially it is used to help smooth out price data by creating a constantly updated average price.
The Strategy enters and closes trades when the following conditions are met:
Entry Conditions:
RSI is greater than 50
MA9 is greater than MA50
RSI increases by 5
Exit Conditions:
Price increases by 1% trailing
Price decreases by 2% trailing
This strategy is back-tested from 1 January 2022 to simulate how the strategy would work in a bear market. The strategy provides good returns.
The strategy assumes each order is using 30% of the available coins to make the results more realistic and to simulate you only ran this strategy on 30% of your holdings. A trading fee of 0.1% is also taken into account and is aligned to the base fee applied on Binance.

RSI Divergence Strategywhat is "RSI Divergence Strategy"?
it is a RSI strategy based this indicator:
what it does?
it gives buy or sell signals according to RSI Divergences. it also has different variables such as "take profit", "stop loss" and trailing stop loss.
how it does it?
it uses the "RSI Divergence" indicator to give signal. For detailed information on how it works, you can visit the link above. The quantity of the inputs is proportional to the rsi values. Long trades are directly traded with "RSI" value, while short poses are traded with "100-RSI" value.
How to use it?
The default settings are for scalp strategy but can be used for any type of trading strategy. you can develop different strategies by changing the sections. It is quite simple to use.
RSI length is length of RSİ
source is source of RSİ
RSİ Divergence lenght is length of line on the RSI
The "take profit", "stop" and "trailing stop" parts used in the "buy" group only affect buys. The "sell" group is similarly independent of the variables in the "buy" group.
The "zoom" section is used to enlarge or reduce the indicator. it only changes the appearance, it does not affect the results of the strategy.

Fast EMA above Slow EMA with MACD (by Coinrule)An exponential moving average ( EMA ) is a type of moving average (MA) that places a greater weight and significance on the most recent data points. The exponential moving average is also referred to as the exponentially weighted moving average . An exponentially weighted moving average reacts more significantly to recent price changes than a simple moving average simple moving average ( SMA ), which applies an equal weight to all observations in the period.
Moving average convergence divergence ( MACD ) is a trend-following momentum indicator that shows the relationship between two moving averages of a security’s price. The MACD is calculated by subtracting the 26-period exponential moving average ( EMA ) from the 12-period EMA .
The result of that calculation is the MACD line. A nine-day EMA of the MACD called the "signal line," is then plotted on top of the MACD line, which can function as a trigger for buy and sell signals. Traders may buy the coin when the MACD crosses above its signal line and sell—or short—the security when the MACD crosses below the signal line. Moving average convergence divergence ( MACD ) indicators can be interpreted in several ways, but the more common methods are crossovers, divergences, and rapid rises/falls.
The Strategy enters and closes the trade when the following conditions are met:
LONG
The MACD histogram turns bullish
EMA8 is greater than EMA26
EXIT
Price increases 3% trailing
Price decreases 1% trailing
This strategy is back-tested from 1 January 2022 to simulate how the strategy would work in a bear market and provides good returns.
Pairs that produce very strong results include AXSUSDT on the 5-minute timeframe. This short timeframe means that this strategy opens and closes trades regularly.
Additionally, the trailing stop loss and take profit conditions can also be changed to match your needs.
The strategy assumes each order is using 30% of the available coins to make the results more realistic and to simulate you only ran this strategy on 30% of your holdings. A trading fee of 0.1% is also taken into account and is aligned to the base fee applied on Binance.

Ichimoku Cloud with MACD and Trailing Stop Loss (by Coinrule)The Ichimoku Cloud is a collection of technical indicators that show support and resistance levels, as well as momentum and trend direction. It does this by taking multiple averages and plotting them on a chart. It also uses these figures to compute a “cloud” that attempts to forecast where the price may find support or resistance in the future.
The Ichimoku Cloud was developed by Goichi Hosoda, a Japanese journalist, and published in the late 1960s. It provides more data points than the standard candlestick chart. While it seems complicated at first glance, those familiar with how to read the charts often find it easy to understand with well-defined trading signals.
The Ichimoku Cloud is composed of five lines or calculations, two of which comprise a cloud where the difference between the two lines is shaded in.
The lines include a nine-period average, a 26-period average, an average of those two averages, a 52-period average, and a lagging closing price line.
The cloud is a key part of the indicator. When the price is below the cloud, the trend is down. When the price is above the cloud, the trend is up.
The above trend signals are strengthened if the cloud is moving in the same direction as the price. For example, during an uptrend, the top of the cloud is moving up, or during a downtrend, the bottom of the cloud is moving down.
The MACD is a trend following momentum indicator and provides identification of short-term trend direction. In this variation it utilises the 12-period as the fast and 26-period as the slow length EMAs, with signal smoothing set at 9.
This strategy combines the Ichimoku Cloud with the MACD indicator to better enter trades.
Long/Exit orders are placed when three basic signals are triggered.
Long Position:
Tenkan-Sen is above the Kijun-Sen
Chikou-Span is above the close of 26 bars ago
Close is above the Kumo Cloud
MACD line crosses over the signal line
Exit Position:
Price increases 3% trailing
Price decreases 3% trailing
The script is backtested from 1 June 2022 and provides good returns.
The strategy assumes each order is using 30% of the available coins to make the results more realistic and to simulate you only ran this strategy on 30% of your holdings. A trading fee of 0.1% is also taken into account and is aligned to the base fee applied on Binance.
